Tabla de Contenidos
Elecciones de Comisión Directiva del CEI
Para ver mas información y fuentes ver la pagina de wikipedia
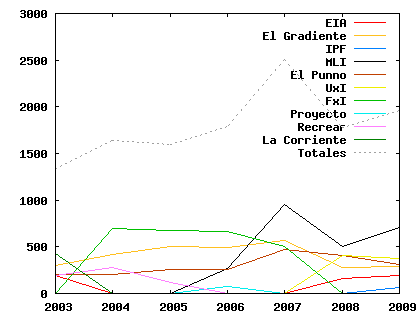
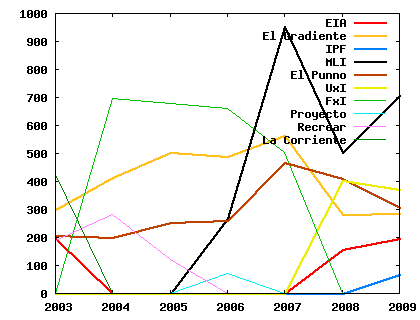
Gráficos
Elección 2016
Votaron: 2520 estudiantes, 2493 votos válidos (2436 estudiantes de grado, 2410 válidos).
- Lista 417 - Movimiento Linealmente Independiente: 48,42% - 1207 votos (6 secretarías) (49,75% - 1199 votos grado)
- Lista 9 - La Mella: 23,39% - 583 votos (3 secretarías) (22,57% - 544 votos grado)
- Lista 7 - Lista 7 de Septiembre (Unidos x Ingeniería, EIA-PO): 10,83% - 583 votos (1 secretaría) (10,95% - 264 votos grado)
- Lista 2 - PRO Ingeniería: 5,7% - 142 votos (1 secretaría) (5,19% - 125 votos grado)
- Lista 10 - Proyecto Ingeniería (La Cámpora + Nuevo Encuentro):5,38% - 134 votos (1 secretaría) (5,44% - 131 votos grado)
- Lista 1 - Franja Morada: 3,59% - 89 votos (3,4% - 82 votos grado)
- Lista 8 - El Puño: 2,73% - 68 votos (2,7% - 65 votos grado)
- Blancos: 18 votos (17 grado)
- Nulos: 9 votos (9 grado)
Elección 2015
Votaron: 2193 estudiantes, 2178 votos válidos (1898 estudiantes de grado, 1888 válidos).
- Lista 417 - Movimiento Linealmente Independiente: 37,37% - 814 votos (5 secretarías) (41,21% - 778 votos grado)
- Lista 6 - La Mella + EPA: 34,25% - 746 votos (4 secretarías) (32,57% - 615 votos grado)
- Lista 7 - Lista 7 de Septiembre (Unidos x Ingeniería, EIA-PO, El Puño): 16,39% - 357 votos (2 secretarías) (16,10% - 304 votos grado)
- Lista 2 - PRO Ingeniería: 9% - 196 votos (1 secretaría) (7,52% - 142 votos grado)
- Nueva Ingeniería: 4,98% - 65 votos (2,60% - 49 votos grado)
- Blancos: 9 votos (4 grado)
- Nulos: 6 votos (6 grado)
Elección 2014
Votaron: 2013 estudiantes.
- Lista 6 - La Mella + EPA: 28,85% - 583 votos (4 secretarías)
- Lista 7 - Lista 7 de Septiembre (Unidos x Ingeniería, EIA-PO, El Puño): 27,76% - 561 votos (3 secretarías)
- Lista 417 - Movimiento Linealmente Independiente: 25,78% - 521 votos (3 secretarías)
- Lista 2 - PRO Ingeniería: 8,31% - 168 votos (1 secretaría)
- Nueva Ingeniería: 4,95% - 100 votos (1 secretaría)
- Unidos y Organizados: 3,56% - 72 votos
- Blancos: 8 votos
- Nulos: 8 votos
Elección 2013
Votaron: 2282 estudiantes, votos válidos 2276.
- Lista 7 - Lista 7 de Septiembre (Unidos x Ingeniería, EIA-PO, El Puño): 31,11% - 708 votos (4 secretarías)
- Lista 9 - La Mella: 21,92% - 499 votos (3 secretarías)
- Lista 417 - Movimiento Linealmente Independiente: 18,85% - 429 votos (2 secretarías)
- Lista 2 - PRO Ingeniería: 10,28% - 234 votos (1 secretaría)
- Lista 6 - EPA (Espacio de Pensamiento Alternativo): 7,91% - 180 votos (1 secretaría)
- UNEN: 4,35% - 99 votos (1 secretaría)
- Lista 1 - IPF (Ingenieros Pensando en la Facultad): 3,25% - 74 votos
- Lista 5 - El Gradiente: 2,11% - 48 votos
- Blancos: 5 votos
- Nulos: 6 votos
Elección 2012
Votaron: 1998 estudiantes.
- Lista 7 - Lista 7 de Septiembre (Unidos x Ingeniería, EIA-PO): 29,26% - 575 votos (4 secretarías)
- MLI + EPA (Movimiento Linealmente Independiente, Espacio de Pensamiento Alternativo): 24,99% - 491 votos (3 secretarías)
- Lista 9 - La Mella: 18,58% - 365 votos (2 secretarías)
- Lista 8 - El Puño: 12,57% - 247 votos (1 secretaría)
- Lista 5 - El Gradiente: 8,91% - 175 votos (1 secretaría)
- Lista 1 - IPF (Ingenieros Pensando en la Facultad): 5,70% - 112 votos (1 secretaría)
- Blancos: 19 votos
- Nulos: 14 votos
Elección 2011
Votaron: 2160 estudiantes, 2137 votos válidos.
- Lista 7 - Lista 7 de Septiembre (Unidos x Ingeniería, EIA-PO, El Puño): 43,43% - 928 votos (5 secretarías)
- Lista 417 - Movimiento Linealmente Independiente: 36,78% - 786 votos (5 secretarías)
- Lista 5 - El Gradiente: 10,58% - 226 votos (1 secretaría)
- Lista 1 - IPF (Ingenieros Pensando en la Facultad): 6,69% - 143 votos (1 secretaría)
- Proyecto Sur: 2,53% - 54 votos
- Blancos: 15 votos
- Nulos: 8 votos
Elección 2010
Votaron: 1968 estudiantes.
- Lista 7 - Lista 7 de Septiembre (Unidos x Ingeniería, EIA-PO, El Puño): 46,80% - 901 votos (6 secretarías)
- Lista 417 - Movimiento Linealmente Independiente: 26,87% - 517 votos (3 secretarías)
- Lista 5 - El Gradiente: 16,52% - 318 votos (2 secretarías)
- Proyecto Sur: 5,82% - 112 votos (1 secretaría)
- Lista 1 - IPF (Ingenieros Pensando en la Facultad): 4% - 77 votos
- Blancos: 29 votos
- Nulos: 14 votos
Elección 2009
Votaron: 1960 estudiantes.
- Lista 417 - Movimiento Linealmente Independiente: 36,07% - 707 votos (3 secretarías)
- Lista 10 - UxI (Unidos x Ingeniería, La Corriente + Estudiantes Independientes): 18,88% - 370 votos (2 secretarías)
- Lista 8 - El Puño: 15,61% - 306 votos (2 secretarías)
- Lista 5 - El Gradiente: 14,64% - 287 votos (2 secretarías)
- Lista 14 - EIA! (Estudiantes de Ingeniería en Acción; Partido Obrero + Independientes): 10,05% - 197 votos (1 secretaría)
- Lista 1 - IPF (Ingenieros Pensando en la Facultad): 3,52% - 69 votos (1 secretarías)
- Blancos: 0,66% - 13 votos
- Impugnados: 0,56% - 11 votos
Elección 2008
Votaron: 1779 estudiantes.
- Lista 417 - Movimiento Linealmente Independiente: 28,71% - 505 votos (3 secretarías)
- Lista 8 - El Puño: 23,37% - 411 votos (3 secretarías)
- Lista 10 - UxI (Unidos x Ingeniería, La Corriente + Estudiantes Independientes): 22,97% - 404 votos (3 secretarías)
- Lista 5 - El Gradiente: 16,03% - 282 votos (2 secretarías)
- Lista 14 - EIA! (Estudiantes de Ingeniería en Acción; Partido Obrero + Independientes): 8,93% - 157 votos (1 secretaría)
- Blancos: 0,8% - 14 votos
- Impugnados: 0,34% - 6 votos
Elección 2007
Votaron: 2512 estudiantes.
- Lista 417- Movimiento Linealmente Independiente: 37,8% - 953 votos (5 secretarias)
- Lista 5 - El Gradiente: 22,5% - 566 votos (3 secretarias)
- Lista 7 - Frente por Ingeniería: 20,4% - 505 votos (2 secretarias)
- Lista 8 - El Puño: 18,5% - 467 votos (2 secretarias)
- Blancos: 0,5% - 12 votos
- Nulos: 0,4% - 9 votos
Elección 2006
Votaron: 1790 estudiantes.
- Lista 7 - Frente x Ingenieria: 660 (36.87%) (5 Secretarías)
- Lista 5 - El Gradiente + “a+FIUBA”+MUE: 489 (27.32%) (3 Secretarías)
- Lista 417 - Movimiento Linealmente Independiente (MLI): 267 (14.92%) (2 Secretarías)
- Lista 8 - El Puño: 262 (14.64%) (2 Secretarías)
- Lista 3 - Proyecto: 70 (3.91%)
- Nulos: 28 (1.56%)
- Blancos: 14 (0.78%)
Elección 2005
Votaron 1597 estudiantes
- Frente x Ingeniería (La Corriente + EIA + Independientes): 680 (42.5%) (5 Secretarías)
- El Gradiente: 505 (31.6%) (4 Secretarías)
- El Puño: 252 (15.7%) (2 Secretarías)
- Recrear: 123 (7.7%) (1 Secretarías)
- Blancos y nulos: 37 (2%)
Elección 2004
Votaron 1643 estudiantes
- Frente x Ingeniería (La Corriente + EIA + Independientes): 695 (42.3%) (5 Secretarías)
- El Gradiente: 413 (25.1%) (3 Secretarías)
- Recrear: 283 (17.2%)(2 Secretarías)
- El Puño: 201 (12.2%) (2 Secretarías)
- Blancos y nulos: 51 (3.1%)
Elección 2003
Votaron 1341 estudiantes
- La Corriente: 426 (4 Secretarías)
- El Gradiente: 300 (3 Secretarías)
- El Puño: 208 (2 Secretarías)
- EIA (Estudiantes de Ingeniería en Acción): 195 (2 Secretarías)
- Recrear: 190 (1 Secretaría)
Excepto donde se indique lo contrario, el contenido de esta wiki se autoriza bajo la siguiente licencia: CC Attribution-Noncommercial-Share Alike 3.0 Unported


